프로메테우스와 그라파나 설치 및 통합
Prometheus 설치
Helm Chart로 설치
- 공식 Docs에 명시된 Helm Chart로 설치 (https://prometheus-community.github.io/helm-charts/)
helm repo add prometheus-community https://prometheus-community.github.io/helm-charts
helm repo update
kubectl create namespace 네임스페이스이름
helm install prometheus prometheus-community/prometheus --namespace 네임스페이스이름
kubectl get all -n 네임스페이스이름
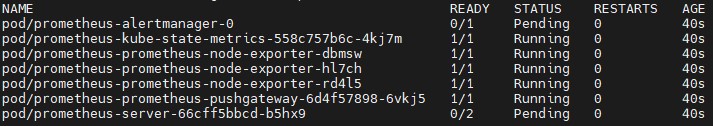
- 설치를 하고나면 위와같이
alertmanger와server가 Pending 상태인 것을 알 수 있다. - 왜냐하면 PV가 바인딩되어있지 않기 때문이다.
PV 바인딩
kubectl patch pvc storage-prometheus-alertmanager-0 -n 네임스페이스이름 \
  -p '{"spec":{"storageClassName":"연결할스토리지클래스이름"}}'

kubectl patch pvc prometheus-server -n 네임스페이스이름 \
  -p '{"spec":{"storageClassName":"연결할스토리지클래스이름"}}'
kubectl get all -n 네임스페이스이름
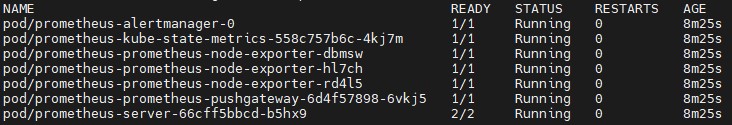
- PV를 바인딩 하고 나면 정상적으로 pod가 실행된 것을 볼 수 있다.
서비스 노출 (NodePort)
kubectl patch service prometheus-server -n 네임스페이스이름 -p '{"spec": {"type": "NodePort"}}'
- 해당 서비스에 접근하기 위해
NodePort로 타입을 변경한다.
kubectl get all -n 네임스페이스이름
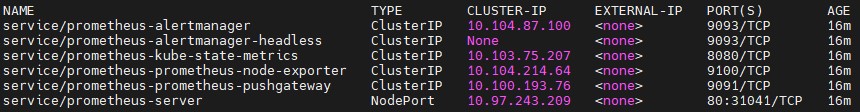
prometheus-server를 보면 노드포트 타입으로 바뀐 것을 확인할 수 있다.
http://노드ip:노드포트(위 사진에서의 http://노드ip:31041) 로 접속해서 확인할 수 있다.
Grafana 설치
Helm Chart로 설치
- 공식 Docs에 명시된 Helm Chart로 설치 (https://grafana.com/docs/grafana/latest/setup-grafana/installation/helm/)
helm repo add grafana https://grafana.github.io/helm-charts
helm repo update
kubectl create namespace 네임스페이스이름
helm install grafana grafana/grafana --namespace 네임스페이스이름
kubectl get all -n 네임스페이스이름
서비스 노출 (NodePort)
kubectl patch service grafana -n 네임스페이스이름 -p '{"spec": {"type": "NodePort"}}'
- 해당 서비스에 접근하기 위해
NodePort로 타입을 변경한다.
kubectl get all -n 네임스페이스이름
![]()
- 노드포트 타입으로 바뀐 것을 확인할 수 있다.
kubectl get secret --namespace 네임스페이스이름 grafana -o jsonpath="{.data.admin-password}" | base64 --decode ; echo
- 위 명령어로 초기 비밀번호를 확인한다.
http://노드ip:노드포트(위 사진에서의 http://노드ip:30087) 로 접속해서 확인할 수 있다.- 로그인
- ID: admin
- PW: 확인한 비밀번호
- 로그인 후,
Home > Administration - Users and access - Users로 가서 비밀번호를 원하는 비밀번호로 변경한다.
통합
Grafana에서 Prometheus 연결
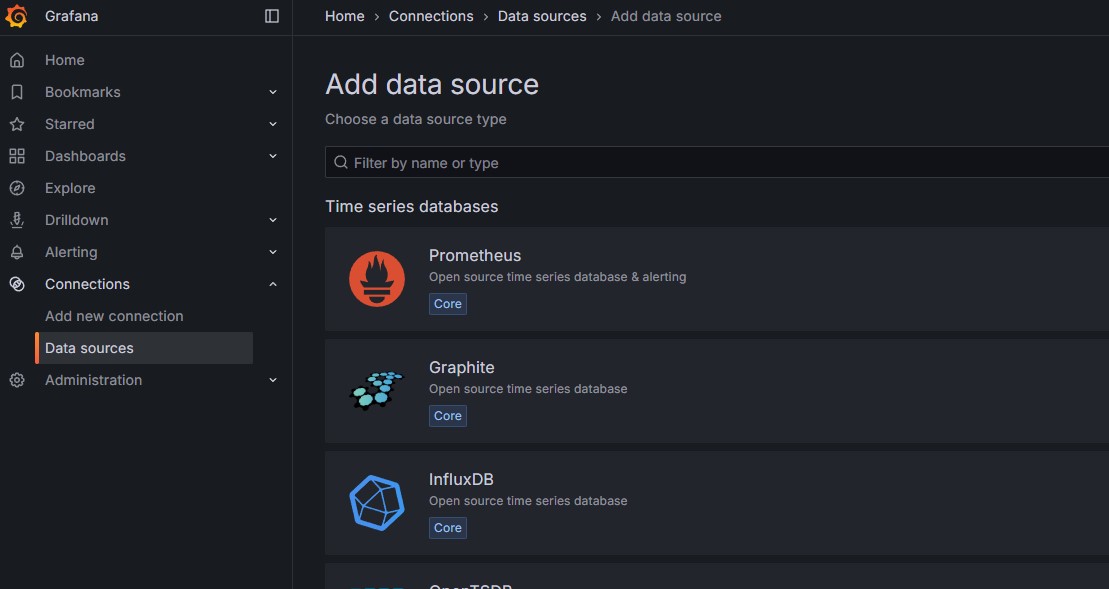
- 좌측 패널 > Connections > Data sources > Add data source
- Prometheus 선택
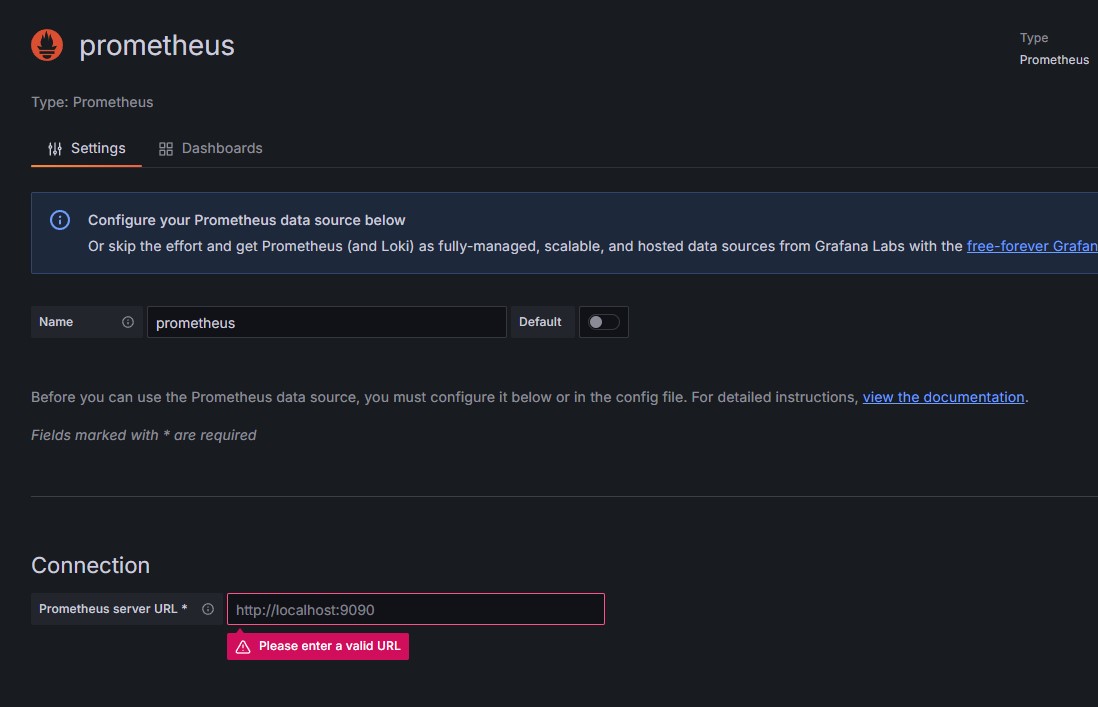
- Connection에 Prometheus URL 입력 후 Save & Test 선택해서 data source 생성
Dashboard 만들기
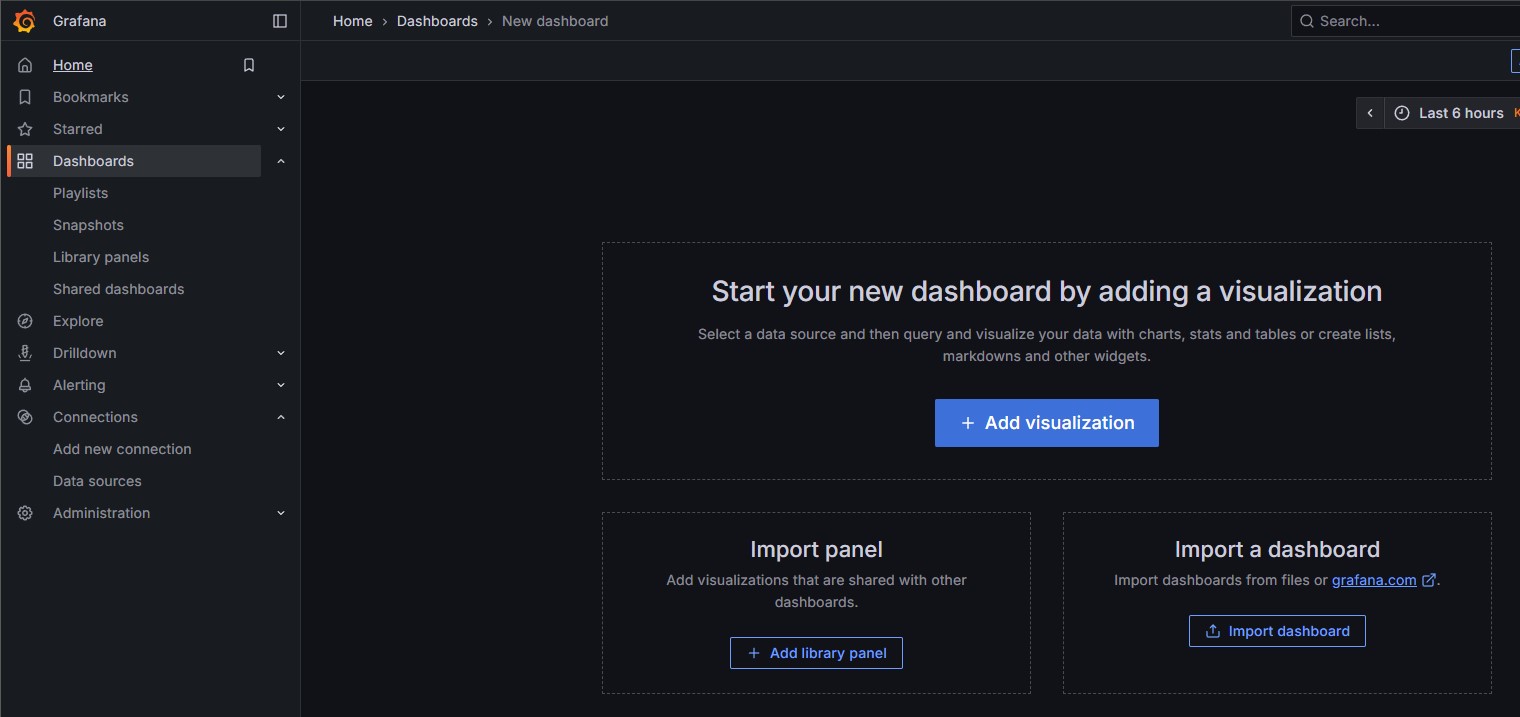
- 좌측 패널 > Dashboards > Create Dashboard
- Add visualizaion으로 직접 추가해도 되지만 나는 템플릿을 사용하였다.
- Import a dashboard 선택
- https://grafana.com/grafana/dashboards/ 여기서 원하는 대시보드의 ID를 기록해두기
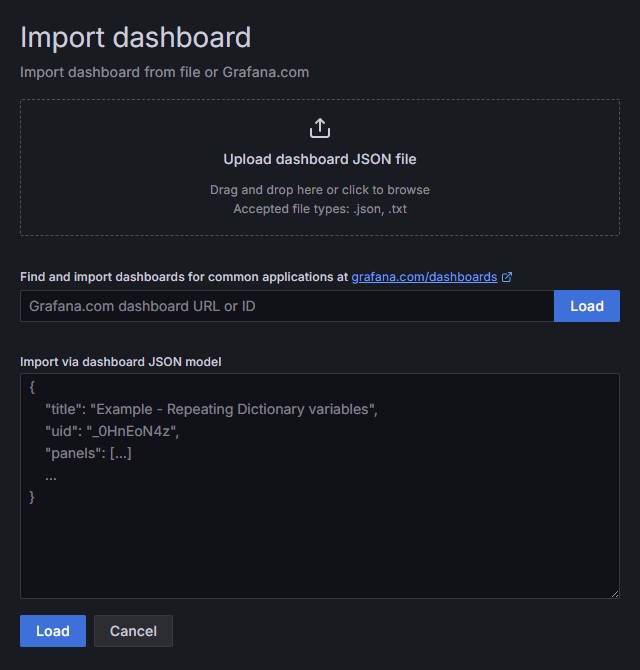
- 원하는 대시보드의 ID 입력하고 Load (나는 1860을 사용하였다)
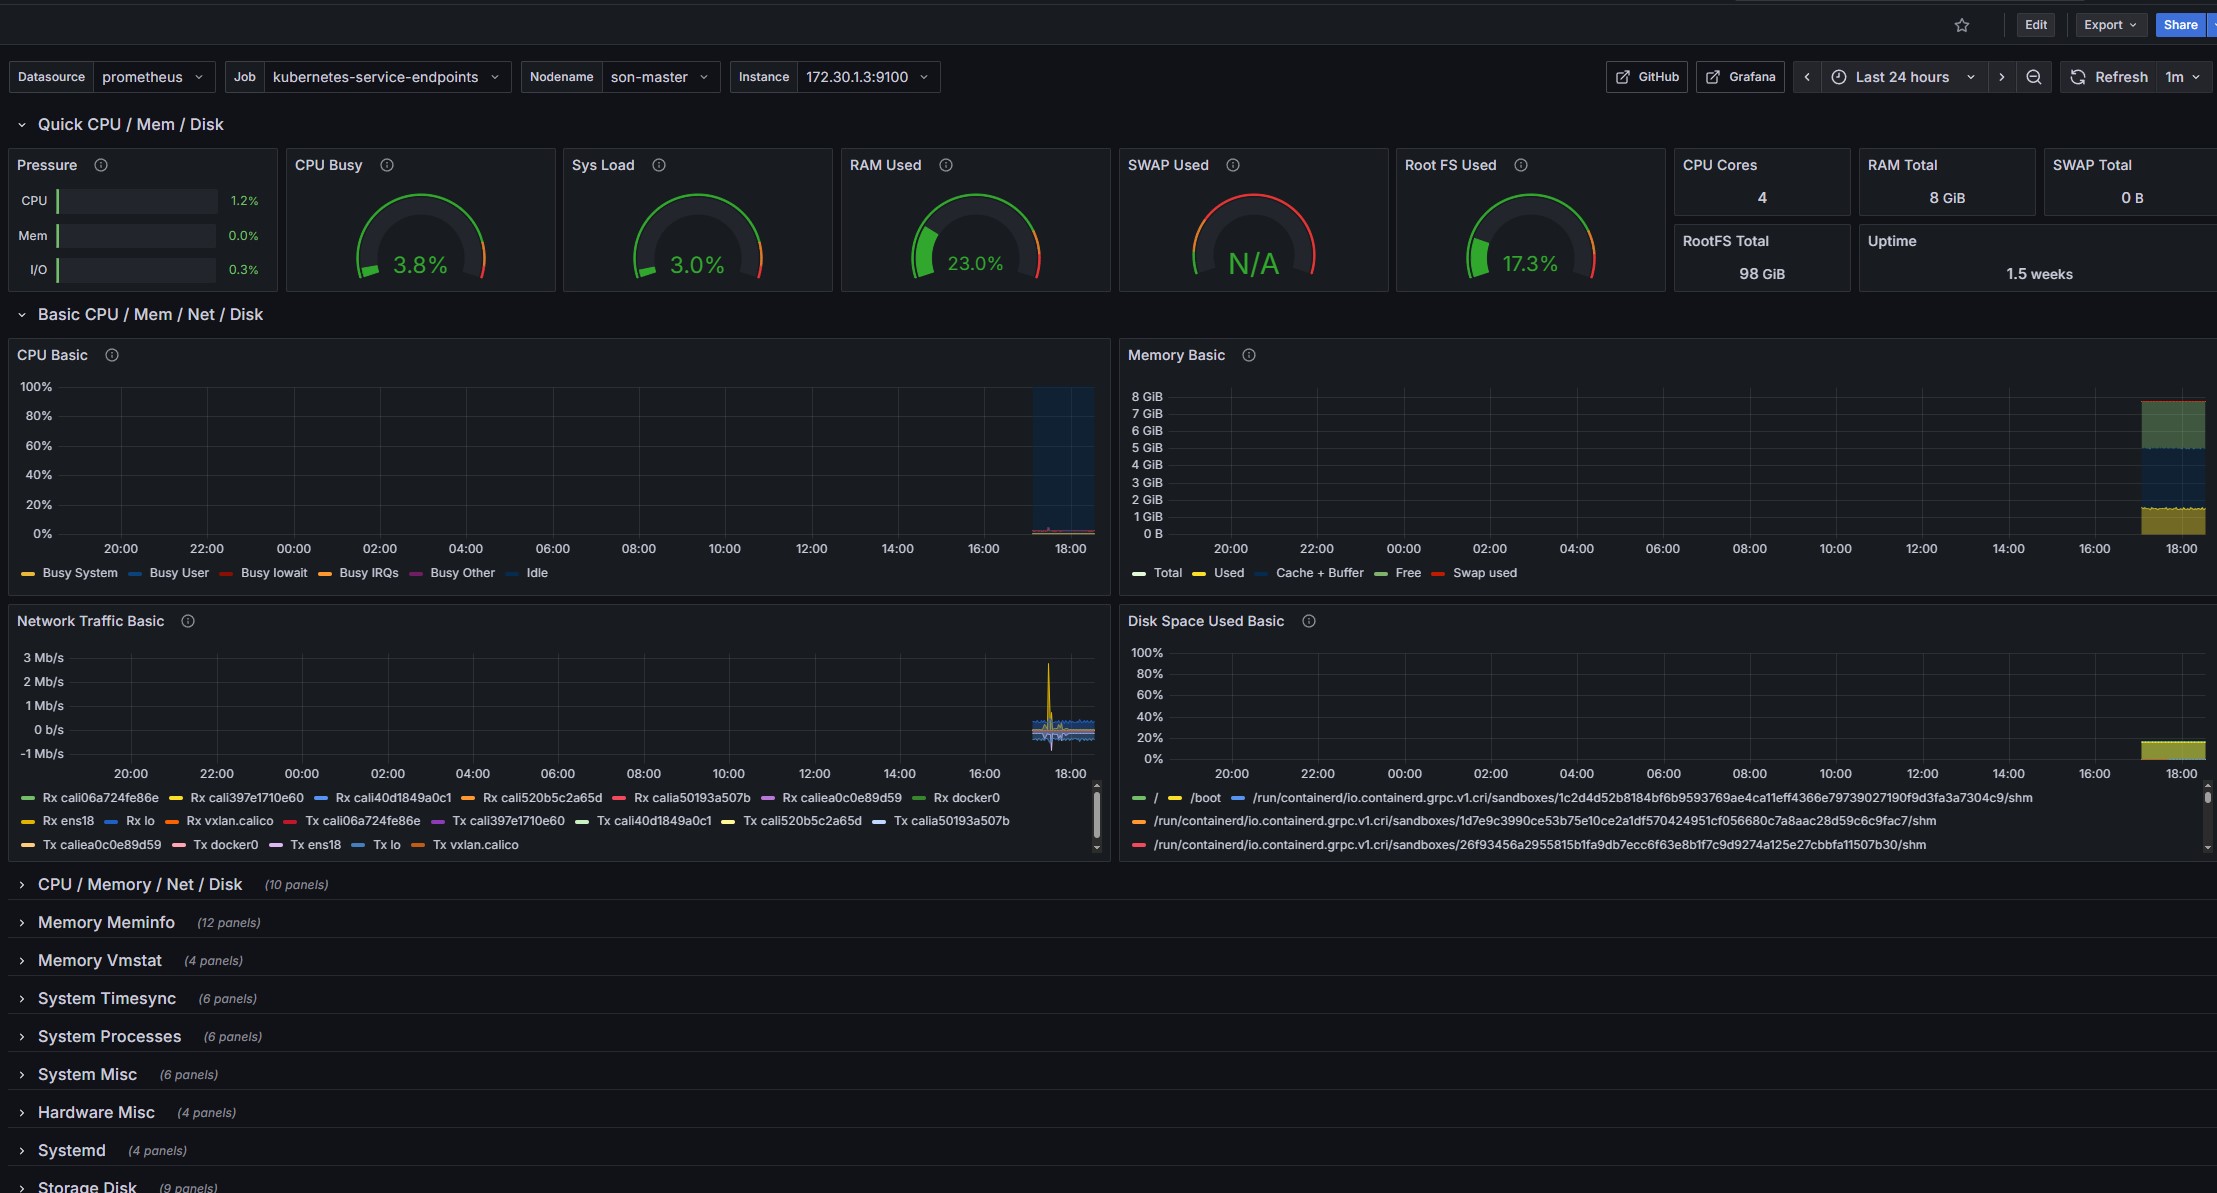
- 연동 완료